
How do you decide which products deserve your time and money? The Boston Consulting Group (BCG) Matrix can help answer that question. Bruce Henderson created this simple portfolio tool in 1970 to help leaders allocate resources across business units. The model compares market growth with relative market share to sort products into four categories.
I remember working with a small retailer that struggled to choose between expanding its online store or its physical locations. By drawing a BCG matrix on a whiteboard, we quickly saw which line of business had room to grow and which one had run its course. When used well, this framework can bring clarity to difficult strategic choices.
Recent market data shows how quickly an industry can expand. For example, the global smartphone market was worth about $802 billion in 2024, and analysts expect it to more than double by 2034 at a 7.3% compound annual growth rate. Rapid growth like this creates opportunities for new products but also raises the stakes for investment decisions.
This blog post explains what the BCG matrix is, how to build one, and why focusing on the right products can boost your returns. It also addresses common limitations and includes a few frequently asked questions. Feel free to leave a comment or share your own experience using this tool.
What is the BCG Matrix?
The BCG matrix is a portfolio management framework that helps companies decide how to prioritize different business units. It is a table divided into four quadrants, each representing a different combination of market growth and relative market share.
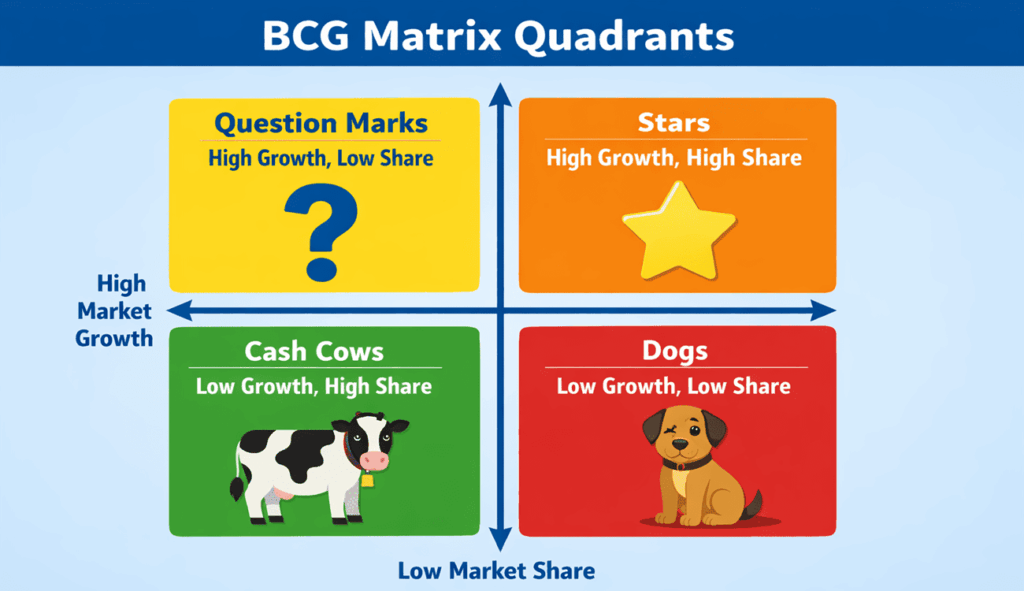
The quadrants are:
| Quadrant | Description | Strategy |
| Stars | High growth, high market share. | Invest heavily to maintain leadership and capture future profits. |
| Cash Cows | Low growth, high market share. | “Milk” these units for cash to fund other segments. |
| Question Marks | High growth, low market share. | Decide whether to invest and become a star or divest to avoid losses. |
| Dogs (also called Pets) | Low growth, low market share. | Consider divesting or repositioning these units. |
The matrix assumes that market leaders enjoy economies of scale that competitors find hard to replicate. As products move through their life cycle, they often start as question marks, become stars if they succeed, and eventually mature into cash cows or dogs.
Why Use the BCG Matrix?
Allocating resources across many products can feel overwhelming. The BCG matrix simplifies this process by highlighting which business lines deserve investment and which ones may be draining resources. According to research by BCG, companies that maintain a focused portfolio from 2010 through 2023 achieved an average relative total shareholder return (rTSR) of 2.3%, compared with 1.6% for diversified peers. This gap shows that concentrating on high‑potential businesses can yield better returns.
Focus Vs Diversification
The following bar chart illustrates the performance difference between focused and diversified portfolios based on BCG’s research.
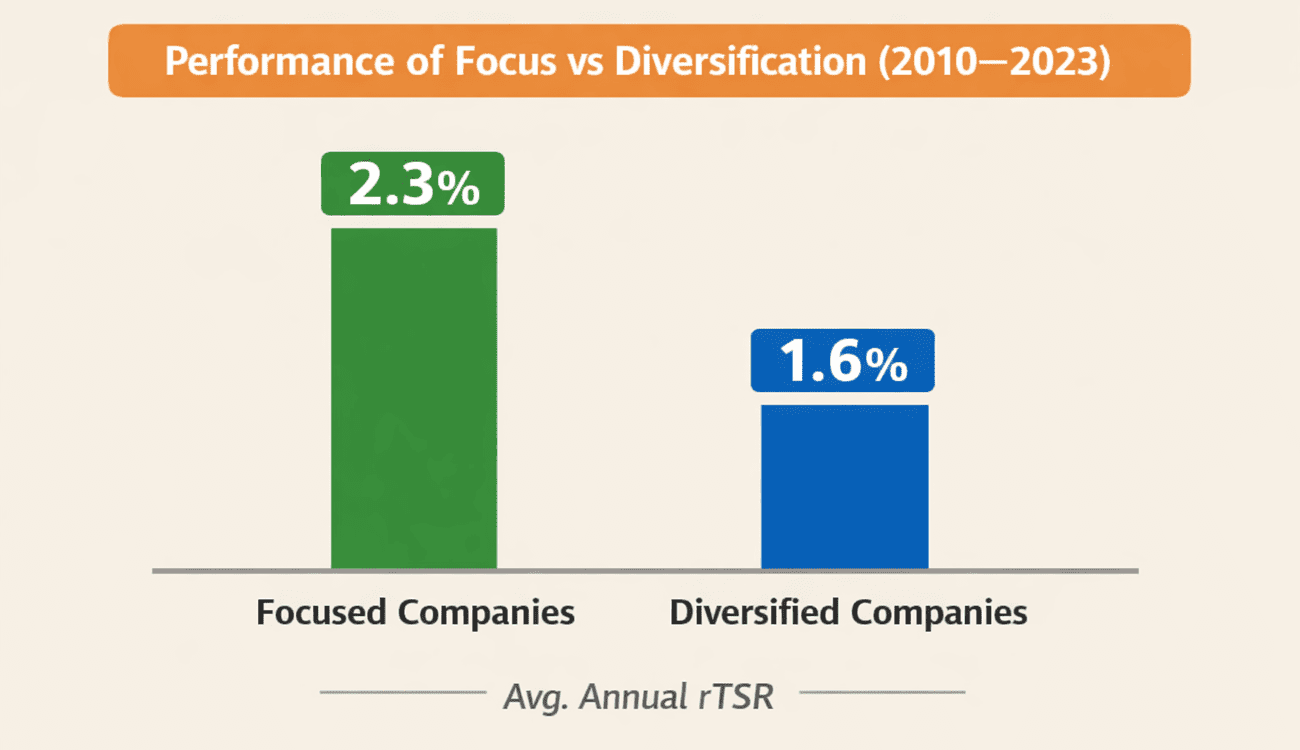
With numbers like these, it’s no surprise that many executives use the BCG matrix to sharpen their strategy. Still, it’s not a magic formula. You need good data and sound judgment to classify products correctly.
How to Use the BCG Matrix
Building and interpreting a BCG matrix doesn’t require complex software.
You can follow the following simple process:
- List Your Products or Business Units: Write down every line of business you want to analyze.
- Gather Data: Estimate the relative market share and market growth rate for each product. Market share compares your sales to the largest competitor, while growth rate reflects how fast the market is expanding.
- Plot each Product: Draw a simple two‑axis chart. Place market growth on the vertical axis (high at the top) and relative market share on the horizontal axis (high on the right). Plot each product according to its values.
- Classify and Prioritize: Assign each product to one of the four quadrants. Invest in stars to stay ahead and in promising question marks that could become stars. Use cash cows to fund growth opportunities. Consider phasing out dogs unless they serve a strategic purpose.
- Review Regularly: Markets evolve. Update your matrix periodically to reflect new data and adjust your strategy accordingly.
Detailed Quadrant Descriptions
Stars
Stars sit in markets with high growth and high share. They generate revenue but also require significant investment to maintain momentum. For instance, cloud computing services like Amazon Web Services (AWS) hold a strong share in a rapidly growing market. AWS reinvests heavily to expand its infrastructure and fend off competition.
Cash Cows
Cash cows have a high share in mature markets. They produce steady cash flow with minimal investment. A classic example is Microsoft’s Windows operating system. The PC market grows slowly, yet Windows enjoys a dominant share and provides funds for Microsoft’s newer initiatives.
Question Marks
Question marks operate in high‑growth markets but have little share. Companies must decide whether to invest or divest. Consider streaming platforms like Disney+. They compete in a booming market yet lag behind leaders. Disney invests in original content to try to turn its service into a star.
Dogs
Dogs (or pets) have low share in low‑growth markets. They may tie up resources without offering much upside. However, some dogs play a strategic role by supporting other products. For example, legacy hardware like DVD players might be unprofitable but still necessary to serve a shrinking customer base.
Real‑World Examples of Using BCG Matrix
Smartphone Industry
Using the smartphone industry illustrates how to apply the BCG matrix. As noted earlier, the global smartphone market was valued at $802.1 billion in 2024, with an expected leap to $1.6 trillion by 2034. Such growth makes smartphones fertile ground for new entrants.
- Apple iPhone: High share and high growth put the iPhone in the star quadrant. Apple invests billions in research and development to maintain its edge.
- Budget Android Brands: Companies like Xiaomi or Realme have rapidly growing products but still trail the market leader. These are question marks that need strategic investment to become stars.
- Feature Phones: As consumers shift to smartphones, sales of basic mobile phones fall. These devices would be classified as dogs.
- Accessory Businesses: Cases and chargers sell in large volumes but see little growth. They sit in the cash cow quadrant and provide steady revenue to fund innovation.
Retail Example
Imagine a multi‑brand clothing retailer. Its premium fashion line has high sales but little room to grow because the market is saturated. That line is a cash cow. Meanwhile, its new sustainable fashion collection sells fewer units but targets a rapidly expanding market. That makes it a question mark. The company can use profits from the cash cow to promote the sustainable line, hoping it will become a star. Seasonal clearance items with low demand and minimal profit are dogs that the retailer might phase out.
Benefits of the BCG Matrix
- Clarity: The matrix offers a clear overview of your portfolio in one glance, making it easier to allocate resources strategically.
- Focus: It encourages investment in high‑potential areas and divestment from poor performers. BCG’s research showing higher returns for focused companies underscores this benefit.
- Simplicity: You don’t need advanced analytics to create the matrix; a few data points can guide meaningful discussions.
- Alignment: The tool helps align teams around a shared understanding of which products matter most.
Limitations of the BCG Matrix
While useful, the BCG matrix has its limitations:
- Oversimplification: Reducing strategic decisions to two variables can ignore important factors like profitability, customer loyalty or technological change.
- Static Snapshot: The matrix captures a moment in time and may not reflect future trends. Markets evolve quickly, so a product’s position can change overnight.
- Data Challenges: Accurate market share and growth data can be hard to obtain, especially for niche industries.
- Subjectivity: Deciding whether to invest in a question mark depends on qualitative judgment, not just numbers.
- Interdependence: Some low‑growth products support high‑growth units. Eliminating them might hurt the broader business.
FAQs
Q1. What are the four quadrants of the BCG matrix?
The quadrants are stars, cash cows, question marks and dogs, which describe combinations of market growth and relative market share.
Q2. Who invented the BCG matrix?
Bruce Henderson of the Boston Consulting Group created the matrix in 1970.
Q3. How often should I update my BCG matrix?
Review your portfolio at least once a year or whenever market conditions change significantly.
Q4. Can small businesses use the BCG matrix?
Yes. The framework applies to any organization with multiple products or services, though estimates may rely more on internal data.
Q5. Is a dog always bad?
Not necessarily. Some low‑growth, low‑share products support other lines or serve loyal customers, so context matters.
Conclusion
The BCG matrix remains a practical tool for organizing and prioritizing business portfolios. By assessing each product’s market growth and share, you can decide where to invest, where to harvest profits and where to divest. Recent research suggests that concentrating on high‑potential businesses can yield better returns. However, no single framework replaces good judgment. Use the BCG matrix as a starting point, supplement it with deeper analysis and adapt it as markets evolve.