Descriptive Analysis was first introduced in the 1700s to help businesses make informed decisions. It produces market patterns from raw data for managers to track business performance. Through descriptive analysis, businesses can present data in an understandable and presentable manner.
What is Descriptive Analysis?
Definition: Descriptive analysis is one of the most common and powerful forms of business analysis. It helps the business track performance and trends. This is achieved by comparing the business’s current position to the competition so that the organization can strategically improve its performance.
The descriptive analysis technique utilizes statical tools to summarize data. After interpreting the data, it generates insights and presents them visually to management to determine the company’s strengths and weaknesses.
How Does Descriptive Analysis Work?
Descriptive analysis collects raw data from multiple sources, then combines this into a single format to conduct an analysis. They use several advanced tools, including artificial intelligence (AI), to make conclusions from the data. After that, the future course of action is decided based on the results.
Most businesses use a single application to store and control data in a single database. The application contains built-in analysis tools that allow the interpretation of meaningful information from the data.
Businesses use descriptive analysis across multiple domains to test their operational efficiency. They can leverage the data to identify goals in their business progression strategy. This method provides analysts with financial metrics like revenue growth to help make informed decisions.
Descriptive analysis helps business in many ways, such as:
- To determine conversion rates for a marketing campaign
- Tracking business progress through visual representation data
- Displaying data graphically to convey the message effectively
Types of Descriptive Analysis
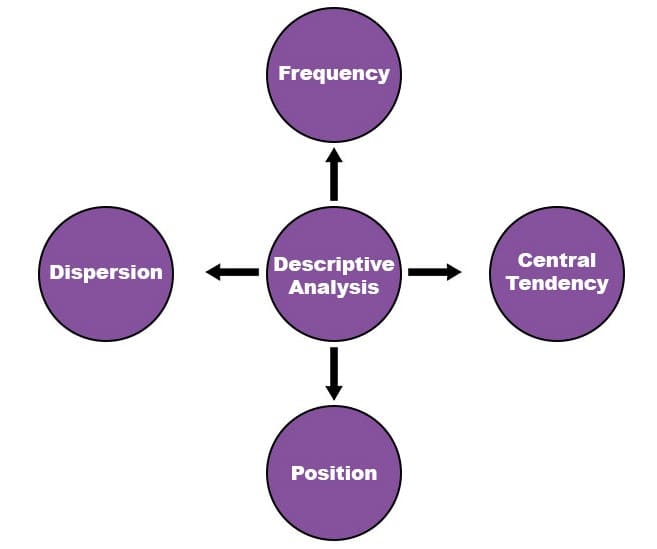
1. Frequency
Frequency is a metric that helps understand how often an event will occur. This is useful when a vast data set needs compilation for easy access.
2. Central Tendency
Central Tendency helps find the average (or likelihood) of conclusions. This allows analysts to present descriptive metrics while understanding market trends. Mean, median, and mode are how companies use central tendency to measure descriptive analysis.
3. Position
Position as a descriptive analysis measure allows analysts to identify a single value’s position compared to others. Analysts use percentiles and quartiles to understand the data’s relationship relative to one another.
4. Dispersion
The measure of dispersion, like standard deviation, helps analysts understand data divisions. It assists in identifying how much data spreads across a range. These variations help analysts understand how far or near the business is from an ideal positioning.
Benefits of Descriptive Analysis
1. High Degree of Objectivity
The descriptive analysis uses data to conclude and identify different characteristics that correspond or match with current trends. Analysts avoid implementing changes if the data does not match what fits within current market trends. The high degree of objectivity in this analysis ensures data is quantifiable and usable.
2. Describes Relationships Between Variables
The descriptive analysis summarizes relationships between two or more variables using tools like scatter diagrams. Businesses compare the relationships between variables through both bivariate and multivariate tools. Following this, they can find market patterns and act accordingly.
3. Follows a Wider Approach
A descriptive analysis follows the broadest approach among all types of analysis as it can use any number of variables for analysis. Billions of data points can be clustered together to make conclusions. This helps businesses make decisions that consider every aspect of the data set.
4. Identifies New Hypotheses
With descriptive analysis, analysts can identify new hypotheses and investigate them through experimental studies. This leads to a smaller margin of error since trends are directly taken from data sets.
5. Flexible
Analysts can use both quantitative and qualitative data to interpret results. Therefore, descriptive analysis is highly flexible and provides a more workable picture of events.
6. Aids in Identifying Business and Market Trends
When an analyst collects a large amount of data for the study, the conclusions provide them with helpful market trends. This helps in identifying areas to focus efforts on. Business operations are broken down by how they affect functionality. By using descriptive analysis, analysts identify business trends and compare current positions to past ones.
How is Descriptive Analysis Implemented?
1. Identify Business Objectives
The first step toward implementing descriptive analysis is to identify business objectives. The analyst defines the need for analysis and the way towards it. The analysis ultimately should be aligned with the business goals.
2. State the Metrics to Use
Next, analysts identify the key metrics to use. These metrics should be aligned with business goals and objectives. This is because the metrics provide businesses with results that will guide their decisions, making the choice of metrics quite crucial.
3. Determine Data Requirements
The next thing is to determine the data requirements for conducting an analysis. Corporations must have enough relevant data across different domains, files, and applications. Companies can also use an Enterprise Resource Planning system to collate their data.
Enterprise Resource Planning makes the data collection process simpler and quicker. Companies also use external data from industry benchmarking databases. This is done to derive information on market trends.
4. Extract and Clean the Data
After acquiring and consolidating the data, companies need to extract, clean, combine and prepare the data for analysis. This process ensures accuracy.
After extraction, analysts clean the data to remove any errors or inconsistencies. This helps in ensuring that the data is reliable.
Next, companies combine data from multiple resources. The combining of data ensures nothing gets left behind. This helps companies organize the data before rendering it.
Lastly, the data is prepared into a suitable format for data analysis. After this step, statistical tools drive the conclusion from the data and help businesses make informed decisions. Many companies nowadays also use data modeling tools. This helps the company organize, prepare, and arrange all data automatically. This is highly beneficial when using complicated data or very large datasets.
5. Data Analysis
After the data is ready for use, companies must analyze the data. This is done through descriptive analysis software like Microsoft Excel. Several mathematical operations help in building conclusions from the data. Then, analysts try to understand the results and use them in organizational decisions.
5. Interpret the Results
After the analysis, the company obtains the results. These results are interpreted as per the company’s objectives (decided in Step 1). When the company attains expected results, the analysis is termed successful. Otherwise, the process is repeated.
6. Communicate the Results
Lastly, the analysts must communicate the results they interpret to other stakeholders. Results must be communicated to different parties per the company objective. Finance specialists are informed when financial data is analyzed. Marketing specialists are informed when social media growth is analyzed.
No matter to whom the data is being communicated, the information should be in a digestible and easy-to-understand format. Analysts often use compelling visual and graphical representations. These representations help in ensuring that results are easily grasped.
Techniques Used for Descriptive Analysis
1. Specialized Descriptive Techniques
Analysts often use specialized techniques to measure inequality, discrimination, and segregation between two or more variables. These techniques help understand the social processes of a business.
For example, a business can use key performance indicators (KPIs) to understand its sales growth. Upon conducting the analysis, the business will have all the information it needs regarding past sales to determine the future trajectory of the business.
2. Tables
Constructing quantile tables, dispersion tables, cross-tabulations, etc., help in carrying out advanced hypotheses. Such hypotheses help businesses understand the difference between different subdivisions of the company.
For example, a business can use tables to determine product price dispersions. The analyst can determine how close or far the product price is from the industry average. Upon getting results, the business can increase or decrease the price accordingly.
3. Crosstabs
Crosstabs are two-way tabulations that help analysts determine promotions of different components. Each variable is given a unique value based on which element of the business can make further decisions.
For example, an analyst can tabulate the proportion of employees that work at the middle management level but also have health insurance benefits. A crosstab of management level and health assistance will define the relationship between the two. After understanding the correlation between the two, the business can increase or decrease health assistance.
4. Tables of Means
An analyst can use a table of means to determine differences between subdivisions. This helps businesses with inferences for future decisions.
For example, this can be used if a business wants to understand the gap in earnings across different management levels. A table of means will help identify differences between all levels of management. The differences will likely be based on the experience level, hours of work, the complexity of work, etc. However, discrepancies in expected results can help guide company decisions.
Example of Descriptive Analysis
Let us consider that Mr. X is a financial business analyst working in a wealth management company. The business needs to analyze their price to earnings ratio for 2022. This metric will help the business understand the value of its stocks in the market. It will also help if the stock’s current market price is overvalued or undervalued.
To conduct this descriptive analysis, Mr. X will first analyze the market price of the company’s stock. He will also run a market analysis to determine whether the stock is overbought or oversold. By doing this, he will generate a corrective price measure that can be used.
Then, Mr. X will need to evaluate the earnings per share. For this, Mr. X can analyze data regarding the company’s profits and outstanding shares in the markets. After running the analysis, the business will have generated an ideal corporate profitability measure. This will help the business reprice its stocks if necessary.
If the descriptive analysis yields a high price-to-earnings ratio, the investors expect higher future earnings growth. In this case, the business can increase and reprice its stocks in the market for a better return.
On the other hand, if the analysis provides a low price-to-earnings ratio, it means that the company is either undervalued or doing better than expected. In this case, maybe no improvement is needed.
Conclusion
Descriptive analysis helps compare current market operations with past trends, which helps businesses move in the right direction. Business analysts can use descriptive analysis to derive basic information and potentially variable relationships. Both outcomes used together help businesses operate more efficiently.