
Definition: Forecasting helps make informed decisions. It uses historical data to predict future trends.
Unlike prediction, forecasting uses logic and has a structured approach. Therefore, the forecaster must articulate and defend logic using past and present data.
Forecasting is the estimation of the magnitude of a future event based on assumptions—every business deals with uncertainty. Uncertainty is a risk that can affect the project or business objectives, such as cost, time, and scope.
The project manager handles this uncertainty through estimating and expert judgment during the planning stage.
They tailor business forecasting toward finance. Planning is necessary for businesses to prepare for the worst and take advantage of the best. Most business forecast includes cash flow, sales, expenses, and market demand. Forecasting helps to know where the business is going.
Types of Forecasting
Forecasting can be of the following two types:
- Qualitative Forecasting
- Quantitative Forecasting
Qualitative Forecasting

Qualitative forecasting is used where data are scarce. For example, when a business wants to launch a new product and looks for projected demand or sales.
This forecasting is common in the R&D. Expert judgment is used in a structured manner with the least bias.
Quantitative Forecasting
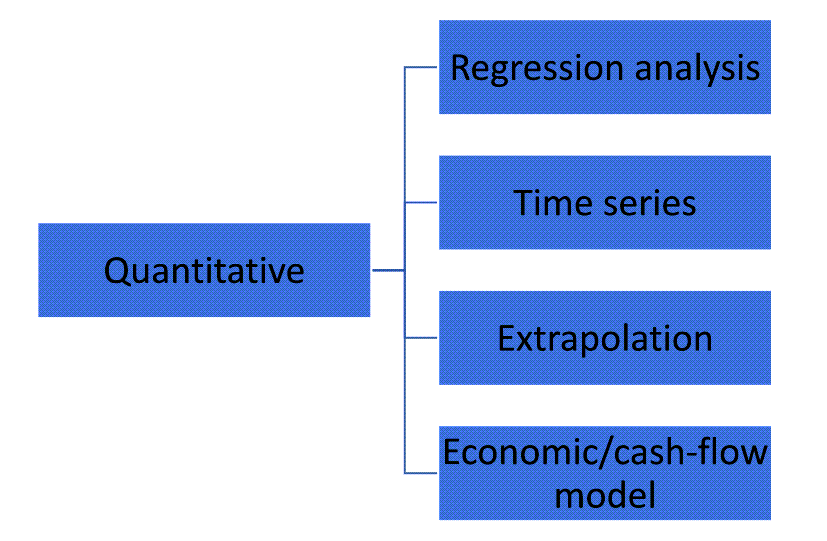
Quantitative forecasting uses past and present data to predict future trends. However, this technique uses objective data for prediction and is time-consuming.
However, forecasting is more accurate with fewer biases.
Forecasting Techniques
A few forecasting techniques are as follows:
Expert Judgment: This is a common planning technique where managers invite subject matter experts to predict, estimate or forecast a future outcome, such as cost, schedule, etc.
The Delphi technique is an example of expert judgment, where a moderator circulates questionnaires to experts. Responses from the preceding circulation lead to the next questionnaire. The experts provide their opinion anonymously, thus eliminating the bandwagon of the majority opinion.
Intuition: This is where the decision-maker makes forecasts based on conviction, perception, etc., without relying on data or models. This technique is a subjective technique that requires experienced experts.
Opinion Poll: This is similar to a market survey where businesses engage the public for their perception or opinion on a matter. Before engaging the market, analysts formulate hypotheses for testing using the survey. Then, they can use it to forecast new-product sales. The respondents give opinions, not necessarily relying on data, so it is a subjective technique.
Regression Analysis or Causal Model: This is a sophisticated forecasting tool based on the data set available for statistical analysis. Here analysts investigate the relationship between dependent and independent variables.
For example, the attrition rate of a department is a function of emolument, working conditions, age, etc. These can be rated and found using the following equation.
Y = a + b+ 3c
Where
Y= Attrition rate
a = Emolument
b = Working condition
c = Age factor
Studies generate data on these variables. Then the least square method is used to determine the regression equation and predict the dependent variable (Y). Finally, managers use statistics to analyze the relationship among the variables further.
Time Series Analysis and Projection: Businesses use a variable’s historical (time-bound) data based on a pattern to predict future values. It is moving from past patterns to the future.
This technique requires real data. For example, the series could be a continuous or discrete set of times with a fixed- time interval and time µ periods. Next, analysts plot the time series observation against the constant interval, as shown below.
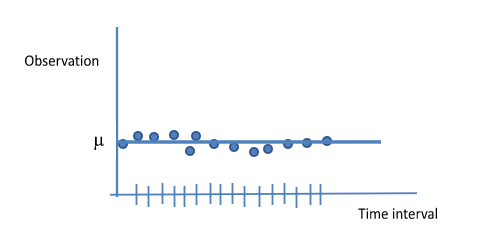
The constant pattern seen here is regarded as the mean; µ. The forecast values for future times are extended from the graph. The assumption here is that the existing patterns will continue. This assumption suffices only for the short-term (3 to 6 months) and is not okay for the long-term projection (above 2 years).
Also, most product life cycles follow S-curve, and the time series does not predict the turning point typical of the curve. That is, where decay begins after a steady growth period.
Trends and seasons do not follow the above constant pattern hence a smoothing or damping factor is introduced to correct the line and enable analysts to predict future values. Since no historical data is available, businesses cannot use time series to forecast new product sales.
Extrapolation: This principle is similar to the time series, extending based on a constant pattern/behavior.
Econometric/Cash-Flow Model: Several interdependent regression equations are built into a spreadsheet to arrive at the model. It is used for long-term projections because it considers factors such as depreciation, inflation, etc.
So, businesses have NPV, IRR, and payback times all captured in one model. Computer simulation, e.g., MS Excel, is used in developing these models.
How to Choose the Right Forecasting Technique?
The selection of the right forecasting technique depends on the data, historical information, experienced, and skills of the experts.
If the business does not have past historical information or statistical data, it will use qualitative forecasting techniques as they have no other choice.
If the business has past data and historical information and more accurate forecasting, it will use quantitative forecasting methods.
Application of Forecasting
- It helps in business planning at various levels; units, departments, and even corporate.
- It facilitates effective or informed decision-making.
- Investors harness it to take advantage of positive market trends and when to divest.
- It aids the research and development of new products, where they build consumer behaviors and expectations.
Limitations of Forecasting
- Accuracy wanes as forecasting plunges farther into the future. A radical shift in demand patterns and general economic conditions may bring much variance. For example, “Analysts predicted in 1980 that one million mobile phones would be used worldwide by 2000. They were wrong by 599 million.” Kurt Hellstrom, president of Ericsson, addressed to Comdex, 2000 (PC magazine, 16-Jan-2000, p. 72).
- It is difficult to eliminate bias, especially in qualitative forecasting.
- Rich historical data are required to conduct effective quantitative forecasting.
- Continuous tracking is needed to validate and revalidate forecasting assumptions.
Conclusion
Forecasting is essential as it provides necessary information for developing business plans. It helps manage scarce resources, and to an investor and product developer, the forecast results can drive all decisions for profitability and market advantage.