
Consider a company that owns dozens of business units. Some products thrive in booming markets, while others struggle in saturated segments. Leaders must decide where to allocate time and money. How can they invest wisely without letting personal bias drive decisions?
The GE McKinsey matrix provides a systematic answer. Developed in the early 1970s, this nine‑cell framework helps Mult business corporations determine how to prioritize investments across their strategic business units (SBUs). Instead of relying on rosy projections from each unit, the matrix judges a business on two factors: the attractiveness of the industry and the unit’s competitive strength. Plotting SBUs across the nine cells reveals whether to invest, maintain or harvest them.
Why Portfolio Analysis Still Matters
In an era where strategies often remain unused, portfolio analysis is more than an academic exercise. A survey of 459 global leaders found that 79% of organizations lack effective strategy reporting, 80% of teams aren’t aligned on priorities and only 3.55% of companies achieve execution maturity. Without a clear system for evaluating business units, leaders waste resources on low‑potential areas while overlooking high‑growth opportunities.
The GE McKinsey matrix forces executives to confront these hard choices, improving both strategy and execution.
What is the GE McKinsey Matrix?
The GE McKinsey matrix is a portfolio analysis framework that organizes SBUs into a 3×3 grid. Each unit receives two scores:
- Industry Attractiveness: This measures how appealing the external market is. High scores indicate a growing, profitable sector with limited competition and strong margins. Factors include market growth, barriers to entry, profitability, regulatory environment and technological changes. For example, a high‑growth renewable‑energy market is more attractive than a stagnant fax‑machine industry.
- Competitive Strength: This gauges how well the business unit can compete in that market. High scores reflect strong market share, brand recognition, product quality, distribution capabilities and financial resources. A start‑up with a small customer base would score lower than an established brand with loyal customers.
By combining these two dimensions—three levels each for attractiveness and strength—the matrix produces nine cells. Units in the upper right are in attractive markets and possess strong competitive advantages; they warrant investment and aggressive growth strategies. Those in the middle may justify selective investment or a wait‑and‑see approach. Units in the lower left struggle in unattractive markets with weak competitive positions and may need to be harvested or divested.
Reading the 9‑Box Matrix
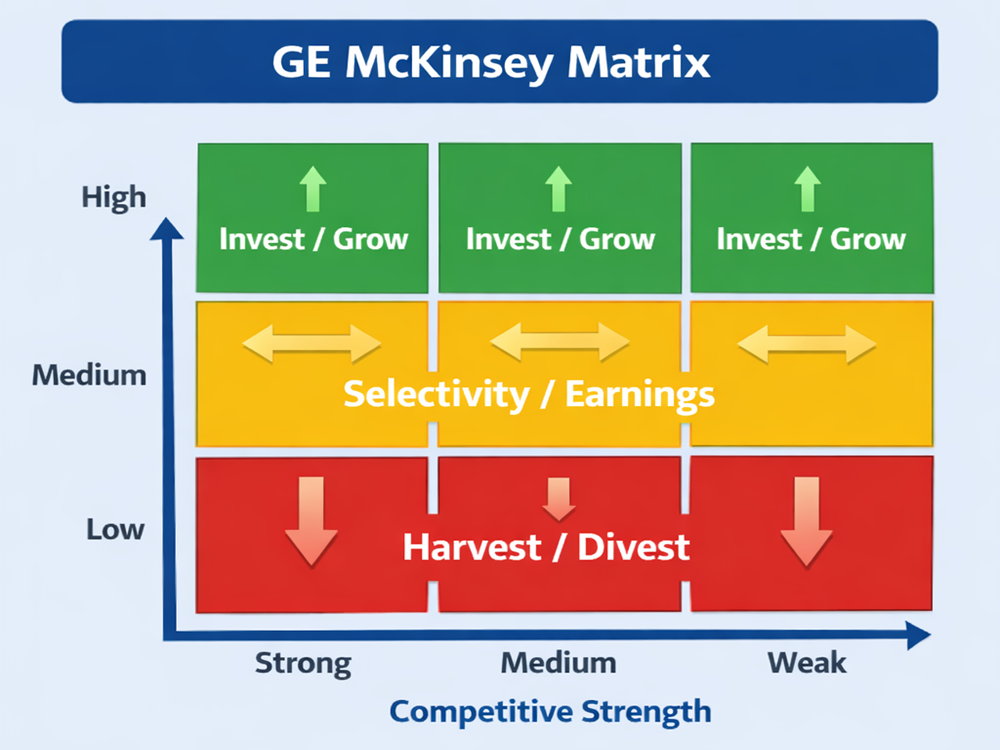
The nine cells form three strategic zones:
Invest/Grow (Green): These units score high on both axes. They operate in attractive markets and have strong capabilities. Management should fund research, marketing and capacity expansion to sustain or grow market share. Many digital‑media services fall into this zone today.
Selectivity/Earnings (Yellow): These units are mixed; either the industry is attractive, but the unit is weak, or vice versa. Management should invest cautiously while exploring whether the product can move into the green zone. For example, a new wearable‑technology line may show promise but needs time to prove its strength.
Harvest/Divest (Red): These units offer low future returns. If a product generates cash but lacks growth prospects, leaders can harvest profits to fund other units. If it continues to lose money, divestment may be prudent. A legacy DVD rental service is a classic red‑zone candidate.
Below is an infographic that visualizes these zones and their color coding:
How to Build a GE McKinsey matrix
Creating an effective matrix involves several steps. The process is more than drawing a 3×3 grid; it requires data collection, scoring and candid discussion:
- Define product–market combinations: List all SBUs, products or services to evaluate. Each entry should represent a unique market and product pairing.
- Identify industry attractiveness factors: Choose criteria such as market size, growth rate, competitive intensity, regulatory risks, technological disruption and profitability. Assign a weight to each criterion based on its importance.
- Identify competitive strength factors: Select factors like market share, brand strength, cost efficiency, innovation capability, supply chain reliability and access to capital. Again, assign weights.
- Assign weight factors: Weights reflect how much each criterion influences the overall attractiveness or strength score. Sum of weights for each axis should equal 1.
- Score each business unit: Rate each SBU against every criterion on a common scale (e.g., 1 to 5). Multiply each score by the criterion’s weight and sum to determine its overall attractiveness and strength.
- Plot on the 9‑box matrix: Place each unit in the cell corresponding to its scores. Use circle size to represent revenue or profit contribution. Draw an arrow if you expect the unit’s position to change over time.
- Evaluate and decide: Discuss investment priorities. Units in green may receive extra funding; those in yellow may be monitored or improved; those in red may be harvested or divested.
Example of GE McKinsey Matrix
Imagine a consumer‑technology company with three SBUs: smartphones, smart TVs and smart appliances.
- Smartphones: The mobile‑device market remains highly attractive because of steady global demand and constant innovation. The company’s smartphone division has a strong brand, a loyal customer base and substantial market share. It scores high on both axes and sits in the invest/grow zone. Management should allocate funds to research new camera technology and software updates while expanding into emerging markets.
- Smart TVs: The smart‑TV market is growing but competitive. The company’s product has moderate market share and a solid brand, but its operating system lags behind competitors. It scores medium on both axes, landing in the selectivity/earnings zone. Leadership might invest selectively—upgrading the operating system and exploring partnerships—while monitoring customer feedback.
- Smart Appliances: This segment operates in a niche market with limited growth and thin margins. The business unit also lacks brand recognition and scale. It scores low on attractiveness and competitive strength, placing it in the harvest/divest zone. Management could either harvest profits by reducing marketing spend or sell the division to focus on core products.
Plotting these units on the matrix helps executives see where to focus their resources. They may decide to reallocate capital from the appliance business to the high‑growth smartphone division, reflecting both market trends and internal capabilities.
GE Vs BCG matrix
The BCG growth‑share matrix classifies products into four quadrants—stars, cash cows, question marks and dogs—based on market growth and relative market share. It assumes that high market share always leads to profitability, which isn’t always true. By contrast, the GE McKinsey matrix evaluates a broader set of factors: market attractiveness and competitive strength. This allows for a more nuanced view. While BCG is simpler, the GE framework offers richer insights because it includes medium categories and uses multiple criteria. Companies often begin with the BCG matrix for a quick scan and then use the GE matrix for deeper analysis.
Limitations and Cautions
No framework is perfect. The GE McKinsey matrix has several limitations:
- Data Intensity: Collecting reliable market and internal data takes time and money. Small firms may lack resources to conduct thorough analyses.
- Subjectivity: Even with weighted scores, rating industry attractiveness or competitive strength involves judgment. Two managers may score the same unit differently.
- Static Snapshot: The matrix offers a point‑in‑time view. Rapidly changing markets can make the assessment obsolete if not updated regularly.
- Interdependence: Business units are sometimes interdependent. For example, a high‑volume unit may support manufacturing economies of scale for another unit. The matrix treats SBUs as independent, potentially ignoring synergies.
- Complexity for Very Large Portfolios: A company with dozens of products may find the matrix cluttered and hard to interpret.
Best Practices
To maximize the value of this tool, executives should:
- Use Diverse Data: Combine quantitative metrics with qualitative insights. Market reports, customer feedback and competitor analysis improve accuracy.
- Engage Cross‑Functional Teams: Involve marketing, finance, sales and operations to balance perspectives and reduce bias.
- Update Regularly: Review the matrix quarterly or annually to account for shifts in technology, regulation or consumer preferences.
- Link to Execution: Don’t let the matrix remain theoretical. Turn the insights into concrete action plans with timelines and accountability.
- Combine Frameworks: Use the GE matrix alongside SWOT analysis, Porter’s Five Forces or scenario planning to form a comprehensive strategy.
FAQs
Q1. What makes the GE McKinsey matrix different from the BCG matrix?
The GE matrix uses two multi‑factor dimensions—industry attractiveness and competitive strength—whereas the BCG matrix relies only on market growth and market share, making the GE matrix more nuanced.
Q2. Who should use the GE McKinsey matrix?
Executives of multi‑business corporations, portfolio managers and anyone deciding how to allocate limited resources among product lines benefit most from this framework.
Q3. How often should I update my matrix?
Update the matrix whenever market conditions or internal capabilities change significantly. Many firms review it annually or after a major market shift.
Q4. Can start‑ups use the GE McKinsey matrix?
Yes, but scoring may be difficult due to limited data. Start‑ups can still benefit by defining success factors and evaluating how their product fits within the broader market.
Q5. Is there software to build the matrix?
Several strategy tools, including spreadsheets and specialized software, can help you gather data, score criteria and plot SBUs. Choosing the right tool depends on your budget and analytical needs.
Conclusion
The GE McKinsey matrix remains a relevant tool for modern portfolio management. By forcing leaders to confront industry attractiveness and competitive strength, it encourages data‑driven decisions instead of gut feelings. When combined with regular updates and strong execution practices, the matrix helps organizations allocate resources wisely and stay competitive.