Ever wonder why some products seem scarce while others pile up on shelves? The answer lies in the meeting point between supply and demand. Market equilibrium is the price and quantity at which buyers and sellers agree. When the quantity supplied matches the quantity demanded, there is no surplus and no shortage.
This blog post explores how equilibrium forms, what happens when prices drift above or below that point, and how businesses find balance in the real world.
What is Market Equilibrium?
Market equilibrium occurs when the quantity that sellers are willing to produce equals the quantity that consumers want to buy. At this point, the market “clears,” meaning there is neither leftover inventory nor unmet demand. The price at this point is the equilibrium price, often labeled P, and the quantity is Q**.
The concept is central to microeconomics. If prices stray from equilibrium, the forces of supply and demand push them back. For example, when the price is too low, consumers rush to buy but producers cannot make enough; this shortage encourages sellers to raise prices until supply and demand balance. Conversely, a price that is too high leads to excess goods; sellers cut prices to clear inventory.
The Supply and Demand Curves
Economists use two curves to visualize this balance. The demand curve slopes downward because consumers buy less as prices rise. The supply curve slopes upward because producers make more as prices increase. These lines intersect at the equilibrium price and quantity.
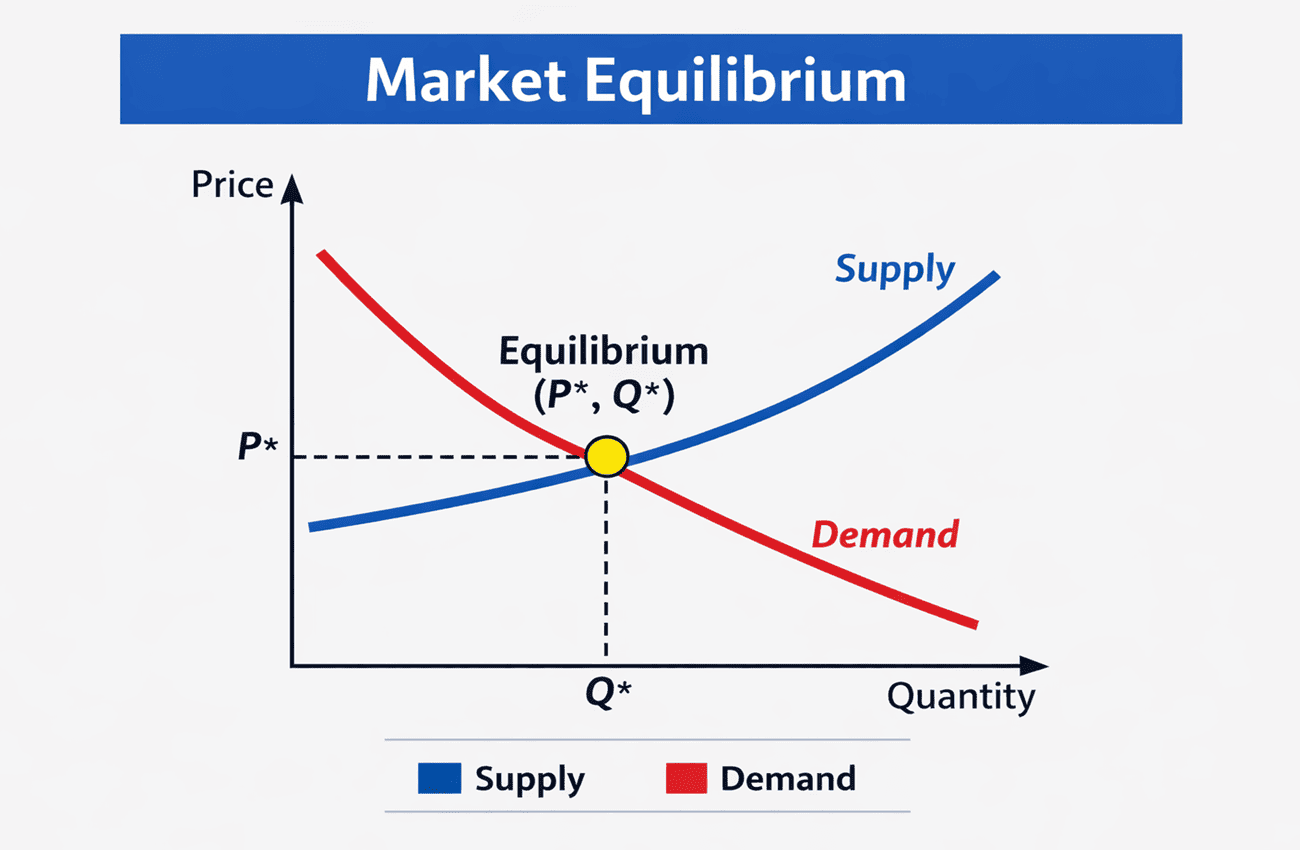
The graph above illustrates the classic intersection. The red line represents consumer demand, and the blue line represents producer supply. Where they cross, the market clears and the price stabilizes. If supply or demand shifts, the intersection moves, changing both price and quantity.
Shortage Vs Surplus
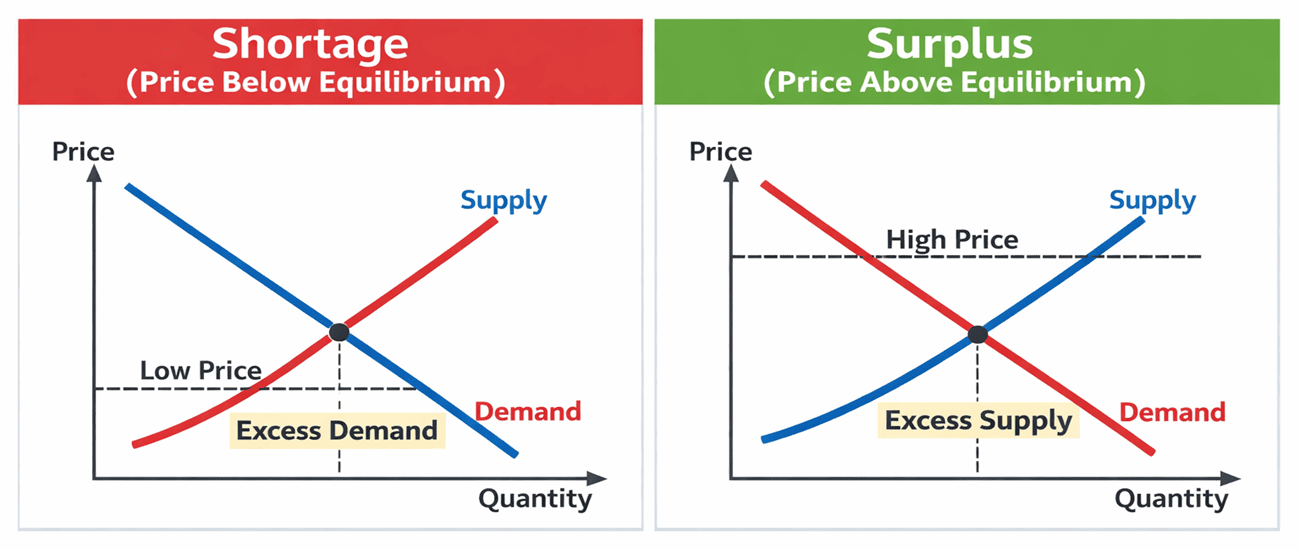
When prices differ from equilibrium, markets experience either shortages or surpluses:
- Shortage (price below equilibrium): At a low price, consumers want more than producers will supply. This “excess demand” creates lines at stores and empty shelves. Sellers respond by raising prices and increasing production. As prices rise, demand drops and supply grows until they meet again.
- Surplus (price above equilibrium): At a high price, producers supply more than consumers want. Goods accumulate in warehouses. To reduce the excess, sellers cut prices and scale back production. As prices fall, demand rises and supply contracts until the surplus disappears.
Shifts in Demand and Supply
Market equilibrium can change when the underlying curves move. Demand shifts right (increases) when consumer incomes grow, preferences change, or new buyers enter the market. It shifts left (decreases) when incomes fall or tastes change. Supply shifts right when production costs drop or technology improves and shifts left when input costs rise or regulations tighten.
When demand increases while supply stays constant, the new equilibrium price and quantity rise. If supply increases while demand stays constant, prices fall and quantities rise. When both curves shift, the direction of the new equilibrium depends on the magnitude of each shift.
Real‑World Examples and Recent Data
The principles of supply and demand are not just textbook theory; they show up in everyday markets.
Example: Refrigerator Pricing
Imagine a company that sells double‑door refrigerators. It initially charges $1,500 per unit but finds that consumers buy fewer than expected, leaving warehouses full. To attract buyers, the company lowers the price to $1,400. Sales improve but inventory still sits on shelves. After another cut to $1,250, demand rises enough to clear the surplus. At this price, the quantity sold matches the quantity produced and the firm reaches equilibrium.
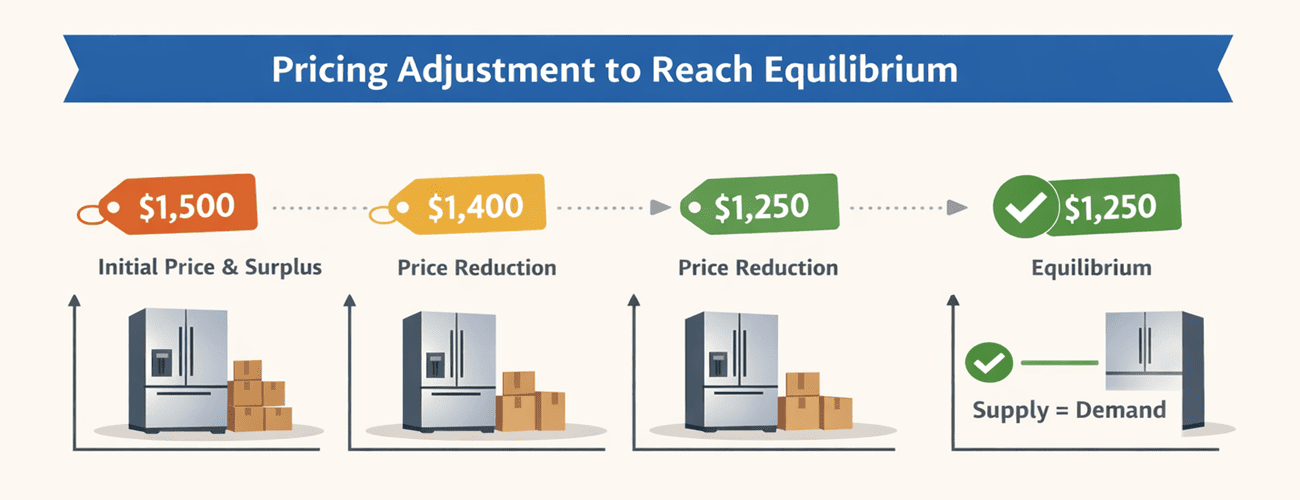
This simple timeline shows how firms adjust prices to balance supply and demand. When inventory piles up, lowering prices encourages more buyers. When goods become scarce, raising prices encourages more production.
Example: Food Prices and Meat Supply
Prices in real markets often move because of changing supply or demand. According to the U.S. Department of Agriculture (USDA), food prices in December 2025 were 3.1% higher than in December 2024; the cost of eating out rose 4.1%, while grocery prices rose 2.4 %. This illustrates how rising demand for restaurant meals can push prices above their historical average.
Beef markets show how supply shortages drive price increases. USDA data report that beef and veal prices were 16.4 % higher in December 2025 than in December 2024 due to a shrinking cattle herd. Consumers still wanted beef, but fewer cattle meant less meat on the market. Strong demand and limited supply pushed prices up. Such an example mirrors the shortage case in the earlier diagram: high demand and low supply result in higher prices until production increases or demand falls.
Another recent study from the Federal Reserve Bank of St. Louis notes that about two‑thirds of price growth between 2021 and 2022 came from demand rather than supply shocks. In other words, consumers were buying more goods and services than the market could readily supply, causing prices to rise. This pattern highlights how shifts in demand can influence equilibrium across many sectors.
Factors That Affect Market Equilibrium
Several forces can move supply and demand curves, altering the equilibrium:
- Consumer income and preferences: Higher incomes allow consumers to buy more, shifting demand to the right. Changing tastes, such as increased interest in plant‑based foods, shift demand between products.
- Production costs: Lower input prices or technological advances shift supply to the right, lowering equilibrium prices. Rising labor or material costs shift supply left, raising prices.
- Number of buyers and sellers: Market entry by new firms increases supply, while more consumers increase demand. Consolidation or exit of firms reduces supply.
- Government policies: Taxes, subsidies, and regulations can shift both curves. For example, a subsidy to farmers may increase supply, while a tax on sugary drinks can reduce demand.
- Expectations: When consumers expect future price hikes, they may purchase more now, temporarily shifting demand right. Producers may also adjust supply in anticipation of future changes.
Understanding these factors helps businesses plan production and pricing. It also informs policy makers who aim to prevent shortages or surpluses in critical sectors like energy and food.
Calculating Equilibrium Price and Quantity
For a more formal approach, economists represent demand and supply with equations. Suppose demand is Q_D = 20 – 2P and supply is Q_S = 4 + 3P, where Q is quantity and P is price. To find equilibrium, set Q_D = Q_S:
20 – 2P = 4 + 3P
Solving yields 5P = 16, so P = 3.2. Substitute this price into either equation to find Q = 13.6. The equilibrium price is $3.20 and the equilibrium quantity is 13.6 units. Real markets rarely have perfectly linear functions, but this simple method shows how supply and demand intersect.
Why Market Equilibrium Matters
Market equilibrium matters because it promotes efficient resource allocation. When prices signal scarcity or abundance, producers and consumers adjust their behaviour. A balanced market prevents wasteful overproduction and reduces the stress of shortages.
For businesses, understanding equilibrium helps with pricing strategies. Setting prices too high may leave goods unsold, while setting them too low can erode profit margins. For consumers, equilibrium ensures that products are available at fair prices. Governments monitor equilibrium to avoid extreme price swings that can hurt vulnerable populations.
FAQs
Q1. What is equilibrium price?
The equilibrium price is the cost at which the quantity supplied equals the quantity demanded. At this price, the market clears and no surplus or shortage exists.
Q2. What happens when there is a surplus?
A surplus occurs when the price is above equilibrium. Producers make more than consumers want, so inventories accumulate. Sellers cut prices to restore balance.
Q3. How does an increase in demand affect equilibrium?
A demand increase shifts the demand curve right. With supply unchanged, the equilibrium price and quantity both rise, as buyers compete for limited goods.
Q4. Can government intervention disrupt equilibrium?
Yes. Price ceilings, floors, subsidies, and taxes can prevent markets from clearing naturally. For example, a price ceiling may cause shortages because producers cannot charge enough to cover costs.
Q5. Why are beef prices rising?
Beef prices rose sharply in 2025 because the U.S. cattle herd shrank while demand stayed strong. Limited supply pushed prices up, illustrating a classic shortage scenario.
Conclusion
Market equilibrium is the quiet force that keeps the economy in balance. Prices adjust until the amount consumers want matches the amount producers are willing to sell. When demand surges or supply falters, the equilibrium shifts, but the basic mechanism remains the same. By understanding how supply and demand interact, and by monitoring data such as recent price changes, businesses and policymakers can anticipate shortages or surpluses and act accordingly. The next time you see a price drop or a long wait for a product, remember that it is all part of the journey toward equilibrium.