Monitoring the level of satisfaction of one’s clientele is an essential step for every company that strives to provide excellent customer service. A Service Level Indicator, or SLI, is a metric that measures and evaluates the level of satisfaction that a company’s customers have with the company’s products or services.
Service level indicators help analyze service level objectives (SLO) with objective data, reduce system faults, and encourage fast response to customer issues.
What is a Service Level Indicator (SLI)?
Definition: Service Level Indicators (SLIs) are a method companies use to evaluate the quality of services they provide to customers. It makes it easier for businesses to pinpoint where they went wrong and speed up the recovery process.
Site latency, error rate, system throughput, response rate, and other similar metrics are examples of essential service level indicators. It analyzes the areas that need to be improved and reveals discrepancies between the data and the SLO.
The percentages that make up the service level indicators are presented. Poor performance is represented by zero percent, whereas excellent performance is represented by one hundred percent. When a company sets its service level target as 95%, and the SLI indicates a 96% response rate, service level agreements (SLA) has achieved the goal.
Types of Service Level Indicators
The SLI can be of two types:
#1. Request-Based SLIs
Request-based SLIs count the total number of completed system requests by comparing the total number of requests in the system to the number of excellent results.
In most cases, this SLI depends on a time frame and aids the service provider in finding challenges in meeting the client’s demands.
The formula to determine the request-based SLIs is as follows:
Request-based SLI (%) = (Excellent Requests / Total Requests) * 100
For instance, a system will have a success rate of 80% if it has 8,000 excellent requests out of 10,000 total requests.
#2. Window-Based SLIs
Service reliability can be evaluated using window based SLIs over a specified period. This supports a company in evaluating the performance of its service over time.
Window-based SLI (%) = (Excellent periods / Total Periods) * 100
For instance, if a service has 8,000 excellent periods that meet the set objectives versus 10,000 total periods during peak hours, you can say that 80% of the measured windows were successful.
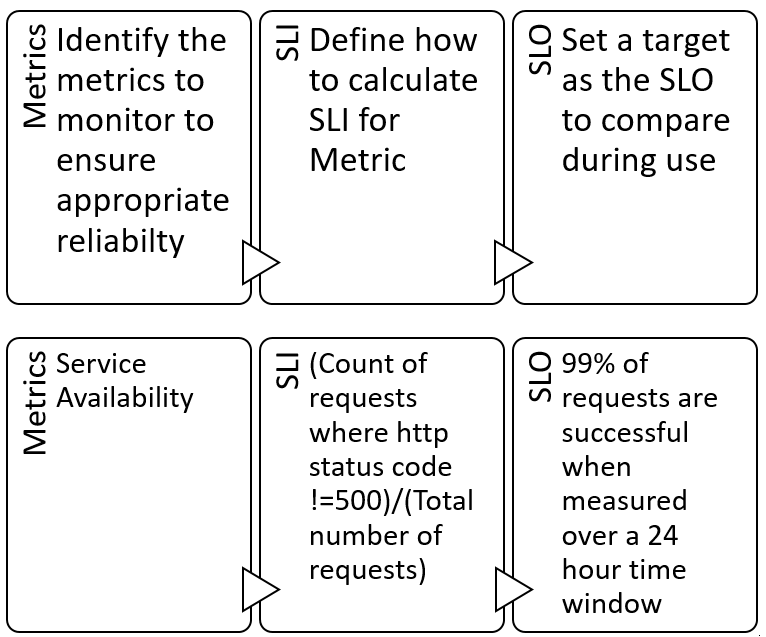
How to Create SLIs?
You can use the following steps to create an SLI:
- First, define service level objectives (SLO).
- To define the SLO, ask questions such as, “How are users engaging with the service?” or “What do they hope to achieve by utilizing the service?”
- Write down the SLOs, decide which goals will most accurately reflect customer interactions with the service, and evaluate the service’s performance.
- Select a metric and specify the data to be collected: When utilizing a request count as a measurement, for instance, you can remove poor, good, and total requests.
- Check the SLIs for changes: Depending on the requests the system handles, what is the latency, and if the service meets the SLOs, changes may occur inside the system.
- To maintain SLIs in line with the SLOs, update them to reflect the changes. For instance, if a 10% availability goal was for the previous month, the SLI metrics can be changed to fit the new goal.
How to Implement SLIs?
Select SLIs: Decide why you need SLIs and how it is helpful. For example, You may require an SLI to assess how well the service works during high traffic.
You can work with the customers to identify the most important SLIs. This guarantees that SLOs live up to the standards set by customers.
Establish the boundaries of the service area that you wish to measure. You must consider the user’s definition of good or available for SLIs to compare the service performance over time rather than at any specific moment.
Measuring SLIs over a specified timeframe, such as an hourly window, is crucial to compare past, present, and future performance because SLIs aim for continuous improvement. To facilitate SLIs, use time metrics like “errors per hour” or “average latency every five hours.”
Create Baseline Data: Establish a baseline with information collected from the SLIs. It helps measure progress quickly and make decisions.
With these baseline data, you can compare future measurements and review the system’s performance.
Track the SLI: To ensure the service meets SLOs, SLIs require routine inspections. Metrics can include daily, weekly, or monthly checks.
This help identifies errors and fixes them to satisfy customers. Determine steps to readjust the system with the original objectives using SLI data.
How Do SLIs Work?
A business should focus on a few key SLIs than measuring every available SLI.
- The most common issues of user-based systems are availability, latency, and throughput. These are related to speed and effectiveness. Questions related to these services are — how many requests system can process? Was the service always available? How long did the service request take to solve?
- The most common issues for systems dealing with storage systems are durability, latency, and availability. They are related to data access and storage. Questions related to these services are – how easy is it to access data? How long does it take to handle the storage of data?
- The most common issues for systems dealing with data are end-to-end latency and throughput. Data systems examine the data processing pipeline to measure how long the system will take to process data and store it in the pipeline.
- Correctness refers to how well a company answers clients’ queries, obtain the right data, does the right analysis, etc.
How to Track and Collect SLI?
SLI performance is expressed in percentage. Zero percentage denotes poor performance, and 100% is ideal.
It is difficult to achieve 100% SLO; therefore, setting a realistic goal of 95% SLO would be ideal.
Having a large number of SLI metrics can make the job more challenging. Because of this, rather than setting SLI measures for each component of a modern software system, you should concentrate on setting SLI metrics for the system boundaries (the area they make their use available to users).
Since SLI metrics track the customer experience, there should be a correlation between customer satisfaction and SLI metrics. A successful service level index (SLI) rises when consumers are pleased with their experiences and falls when they are unhappy.
With no downtime, the customers’ satisfaction stays constant, and the metrics have little fluctuation.
You can use metrics to identify the connection between client satisfaction and service. Customer feedback, such as calls to customer service centers, remands on support forums, and comments on social media, provides an idea of how customers feel about the service.
Although these signals can be utilized as service level indicator measurements, they are not recommended because they can have biases. Instead, they can calibrate new SLI and serve as a starting point.
Comparing SLI with happiness can indicate a trend.
Focus on SLIs that impact customers’ satisfaction. Either create category tags, perform post-process actions to get rid of batch queries, or take the SLI measurement at a different location.
What are Common SLI Metrics and Terminology?
The following are some of the common SLI metrics and terms:
- Latency: The time it takes for a query to be completed.
- Error Rate: It tracks the quantity or intensity of errors made during the client experience.
- Throughput: System throughput is determined by the number of requests processed per second or the total amount of data sent to all connected terminals in a network.
- Availability: The rate of time a service is available. It provides information on how effective a service is during the measuring period.
- Durability: Durability is crucial to logging and data storage, which is the percentage that businesses can keep data over time.
- Yield: Yield is the percentage of successfully submitted and well-written service requests. High yield is a reliable indicator of precision and correctness.
Benefits of SLIs
The benefits of SLIs are as follows:
- Check and view performance metrics.
- Tracking customer satisfaction for the service provided by the organization.
- Determine areas for refinements and improvements.
- Notifies if something is not going as anticipated and implement corrective actions.
- Boost and encourage engineers to prioritize tasks and develop or create shared goals.
Service Level Indicator Examples
A company may desire to measure certain SLIs metrics like:
- The system’s delays are measured by request latency. A better user experience is connected to lower latency.
- The error rate measures how frequently mistakes are introduced into a system.
- Traffic gauges how much pressure a system is under.
- The degree of availability indicates how frequently users may access the system online.
- The possibility of keeping data for a long is measured by durability.
- Saturation gauges how occupied the system is.
Conclusion
Service and support are sensitive to the needs of the customer are essential to the success of a business. By concentrating on the essential SLIs, businesses may save money, time, and effort while simultaneously improving the SLO and the experience that customers have with customer service. Because of this, they can expand their business and increase their brand recognition.